Renal Nutrition
Low-Sodium Label Decoder for CKD (What the Claims Actually Mean)
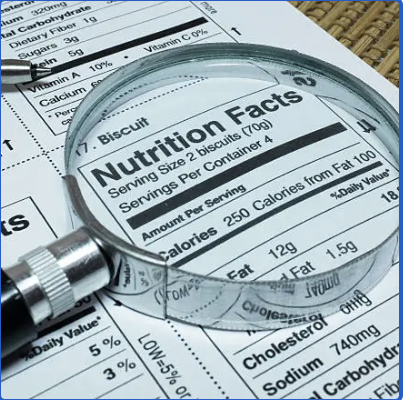
Most US adults — and the overwhelming majority of CKD patients — exceed 3,400 mg sodium daily, well above the 2,300 mg general recommendation and the 1,500–2,000 mg target appropriate for most adults with hypertension or CKD [1]. The reason isn't the salt shaker; CDC and AHA estimates consistently put 70–75% of dietary sodium intake on packaged and restaurant foods, where front-of-pack health claims are deliberately written to sound healthier than the per-serving milligrams actually are [2]. Decoding a label for sodium content takes about 10 seconds once you know the rules — and those 10 seconds, applied at the grocery store, are one of the single highest-leverage interventions in CKD and cardiovascular nutrition.
This guide walks through the official FDA per-serving definitions, the categories where sodium creep is worst, the difference between sodium and salt (they are not the same number), the 'serving size trap' that doubles or triples what the front of the package suggests, and a practical 5-rule scanning protocol you can use in real time.
Why sodium matters at this level of detail in CKD
Excess dietary sodium drives blood pressure upward, expands extracellular fluid volume, blunts the antiproteinuric and renoprotective effects of ACE inhibitors and ARBs by 30–50%, accelerates left-ventricular hypertrophy, and is independently associated with faster CKD progression in observational cohorts [5]. The DASH-Sodium trial demonstrated systolic BP reductions of 8–12 mmHg from sodium reduction alone in hypertensive adults [3]. Current guidelines recommend <2 g sodium/day for most adults with CKD and BP control [4]; for stage 4–5 or heart failure overlap, many clinicians target 1,500 mg.
Sodium vs salt — the conversion that catches everyone
Salt (sodium chloride) is roughly 40% sodium by weight. Labels report sodium in milligrams; recipes and shakers usually talk in grams or teaspoons of salt. Mixing the two units is the reason so many 'careful' eaters still blow past their daily target — one teaspoon in a soup pot is the entire KDIGO daily budget for CKD in a single dish [4].
FDA sodium label claims — what they actually mean
The FDA regulates exactly which phrases can appear on the front of a package [2]. Some of them are hard limits; others are relative to a comparison product and can still be very high. This ladder shows how the claims actually stack up in milligrams per serving.
| Claim | Per-serving definition | What it really means |
|---|---|---|
| Sodium-free / Salt-free | <5 mg | Truly low — safe choice |
| Very low sodium | ≤35 mg | Excellent option for CKD |
| Low sodium | ≤140 mg | Good benchmark — aim for this on packaged foods |
| Reduced sodium | 25% less than the reference product | Could still be very high — read the mg |
| Less sodium / Lower sodium | 25% less than reference | Same caveat as 'reduced' |
| Light in sodium / Lightly salted | 50% less than reference | Often still >200 mg/serving |
| No salt added / Unsalted | No salt added in processing — not necessarily low sodium | Read the mg; some naturally high |
| Healthy (new FDA 2024 rule) | <10% DV sodium per serving (~230 mg) | Better than nothing, still not low for CKD |
The serving-size trap — the single biggest source of label deception
Cross-check the serving size box at the top of the label before reading the sodium row. A 'reduced sodium' soup at 600 mg per cup with a container holding two cups is 1,200 mg per bowl — over half the daily CKD limit in one meal. A 20-oz bottled drink labeled '2.5 servings' may list 70 mg per serving but deliver 175 mg total. Manufacturers know most consumers anchor on the per-serving number; the serving size is engineered to keep that number under a psychological threshold.
The single number that matters
Milligrams of sodium per the amount you actually eat — not the amount labeled. Calculate the true per-portion sodium, multiply by your realistic intake of that food in a day, and budget against your daily target (typically 1,500–2,000 mg for CKD). If a single food contributes more than 25% of your daily sodium target, that's a candidate for substitution, not negotiation.
The worst hidden sources (adapted from the AHA 'Salty Six' for CKD)
These categories account for a disproportionate share of dietary sodium in the US [2]. Within each category, brand-to-brand variation is often 3–5×, so the lowest-sodium option in the same aisle is almost always dramatically better than the average one.
Bread & rolls (100–230 mg/slice)
The single biggest source in the US diet by volume — not because any one slice is high, but because most people eat several a day. Look for <100 mg/slice options or bake at home.
Pizza (800–1,200 mg/slice)
One slice can burn half a tight CKD budget. Half a slice with a big salad; or homemade with low-sodium dough and light cheese.
Deli & cured meat (400–700 mg per 2 oz)
Sodium is a preservative here, not a seasoning. Roast a plain turkey breast on Sunday and slice it for the week — 40–60 mg per 2 oz.
Canned soup & broth (400–900 mg/cup)
Even 'reduced sodium' soup is usually still 400+ mg/cup. Build from no-salt-added stock and season with acid, aromatics, and herbs.
Restaurant sandwiches & burritos (1,000–2,500 mg)
Cheese, cured meat, and condiments stack fast. Open-face, sub greens for cured meat, sauces on the side.
Condiments (120–1,100 mg/tbsp)
Soy sauce, teriyaki, BBQ, ketchup, salad dressing. Lemon + herbs + vinegar cover most of the flavor role without any sodium.
Frozen meals (600–1,500 mg/entrée)
Even 'healthy' frozen lines rarely go below 500 mg. Batch-cook and freeze your own portions instead.
Pickles, olives, capers (300–800 mg/serving)
Fine as an accent, ruinous as a staple. Treat them as a garnish, not a side.
Five high-yield label habits
Aim for ≤140 mg per serving
The FDA 'low sodium' threshold. Any packaged food you eat regularly should sit at or below this line.
Use the 5% / 10% DV shortcut
≤5% Daily Value sodium per serving is low; ≥20% is high. Fast visual scan when you can't do arithmetic in the aisle.
Compare two brands side-by-side
Sodium varies 3–5× across similar-looking products. The lowest brand in the aisle is almost always dramatically better than the average one.
Scan for KCl if you're on RAS blockade
'Potassium chloride' or 'KCl' in a salt-substitute or 'no salt added' product can push potassium into the danger zone on ACE/ARB/MRA.
Watch for 'PHOS-' ingredients
Any ingredient starting with 'phos' is an added phosphate — 90–100% absorbed. Sodium's invisible cousin in the renal diet.
Building a low-sodium pantry
The single fastest way to lower average daily sodium is to change what's on the shelf, not what you're willing to eat. A pantry built around the ingredients below makes low-sodium cooking the path of least resistance — you're not fighting a craving, you're just cooking what's there.
Salt-free spice blends
Mrs. Dash (Original, Lemon Pepper, Italian Medley), Penzeys salt-free blends, homemade za'atar, herbes de Provence, ras el hanout, garam masala.
Vinegars & acid
Balsamic, sherry, rice wine, apple cider, red wine, white wine. Acid does what salt does for perceived brightness — without the sodium.
Citrus
Lemons, limes, oranges. Zest carries most of the flavor; juice carries the acid. Both add lift to almost any savory dish.
Aromatics
Garlic, onion, shallot, ginger, scallions, and fresh herbs (basil, cilantro, parsley, dill, mint). The base layer of low-sodium cooking.
Umami without salt
Nutritional yeast, unsalted tomato paste, dried mushrooms, roasted garlic. Small amounts of miso only — high sodium.
No-salt-added canned goods
Tomatoes, beans, and vegetables in NSA versions are widely available. Rinsing standard canned beans drops sodium ~40%.
Restaurant survival rules
Assume 1,500–3,000 mg per meal
Unless you have ingredient-level control, treat every restaurant meal as the majority of your daily budget. Plan the surrounding meals accordingly.
Sauces & dressings on the side
Use ~25% of what's provided. Dip the fork in the dressing, then the food — not the other way around.
Choose the cooking method
Grilled, baked, steamed, roasted. Avoid breaded, fried, brined, cured, smoked, pickled — all of those are sodium-delivery vehicles.
Ask for veg without salt/butter
Steamed vegetables prepared without added salt or butter are almost always available on request, even when they're not on the menu.
Skip the bread & chip baskets
Free carbohydrates at the table are the highest hidden sodium load of the meal — often 400–800 mg before the entrée arrives.
Budget across the week
If you eat out frequently, treat restaurant days as your higher-sodium days. Keep home-cooked days tight to average out.
How fast blood pressure responds to sodium reduction
Most adults see measurable BP reductions within 2–4 weeks of sustained sodium reduction. The DASH-Sodium trial showed peak BP effect at 30 days [3]. Salt-taste preference adapts within 8–12 weeks — foods that initially taste 'bland' begin tasting properly seasoned, and previously-normal foods start tasting unpleasantly salty. The adaptation is real and biological, mediated by sodium receptor density changes on the tongue.
References
- 1.Quader ZS, et al. Sodium intake among US adults — NHANES, 2013–2014. MMWR Morb Mortal Wkly Rep 2017;66:324–238. Read source ↗
- 2.U.S. Food and Drug Administration. Sodium in your diet — major dietary sources and label guidance. Read source ↗
- 3.Sacks FM, et al. Effects on blood pressure of reduced dietary sodium and the DASH diet (DASH-Sodium). NEJM 2001;344:3–10. Read source ↗
- 4.KDIGO 2024 Clinical Practice Guideline for the Evaluation and Management of CKD. Kidney Int 2024;105(4S):S117–S314. Read source ↗
- 5.Mills KT, et al. Sodium excretion and the risk of CV events in CKD. JAMA 2016;315(20):2200–2210. Read source ↗
- 6.Vegter S, et al. Sodium intake, ACE inhibition, and progression to ESRD. J Am Soc Nephrol 2012;23(1):165–173. Read source ↗
- 7.Neal B, et al. Effect of salt substitution on cardiovascular events and death (SSaSS). NEJM 2021;385:1067–1077. Read source ↗
About the author
Swetha Raju
Columbia M.S. Candidate in Clinical Human Nutrition · AKF Certified Kidney Health Coach · NKF Medical Advisory Committee (MAC) Member · NKF peer mentor · CKD patient advocate · Published chronic disease and nutrition researcher
Swetha Raju is the founder of NephroNourish. As a published researcher and lifelong chronic disease patient, she translates renal nutrition and metabolic science into practical guidance people can actually use.
A note on scope. This article is educational and not individual medical advice. Always discuss changes with your nephrologist, dietitian, or care team.